In this strategy, we are using 2 indicators on a H1 chart. First we create our two EMA, as it is described in the strategy with 2 EMA's. If we do this, we add the MACD indicator added to the chart. If we chose the MACD, reopens a window in which we can set the parameters. We set the parameters as follows: "Fast EMA = 9", "Slow EMA = 18" and "MACD SMA = 6". When we have done this, should be similar to the example of our chart image.
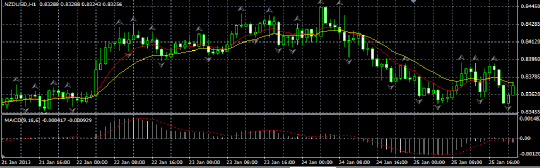
Now we have to find our entry point. In the example image can be seen that the red line of the EMA at 15:00 clock crosses the yellow line. TheMACD remains at this time but is relatively close to the zero line. Against 03:00 clock the MACD exceeds significantly from the zero line. At this point, we open our long trade. The right time to close the trade is, as always, a matter of style . Close to the trade as a strong signal, it can be seen when the MACD with two lines running back to the zero line. As it can be considered safest signal when the MACD breaks the zero line with both lines. In the example image can be seen here that can open up a new trade in the opposite direction.
