A persecuted strategy by many forex traders is the strategy with the Fibonacci Retracements. It is based on a mathematical principle, which was discovered in the 12th Century by the mathematician Leonardo da Pisa, who is also known under the name Fibonacci. It is a series of numbers in which each third number is the sum of the two preceding numbers and structured as follows:
1, 1, 2, 3, 5, 8, 13, 21, 34, 55, 89.....
Dividing the numbers of this series by the next, starting with the 21, always the rounded ratio of 0.618 follows.
If you divide a number in this series, through the second next, starting with the 13, it always produces the rounded ratio of 0.382.
Other conditions are obtained by dividing by the third next, the fourth next number and so on. They give our Fibonacci Retracement points in the chart. These results are known as the so-called "golden section". However, we aim here is not to explain in detail, but make it clear how we can use it to identify reversals of the trading. If you want to dig deeper into the Fibonacci sequence of numbers, we can recommend the article at Wikipedia.
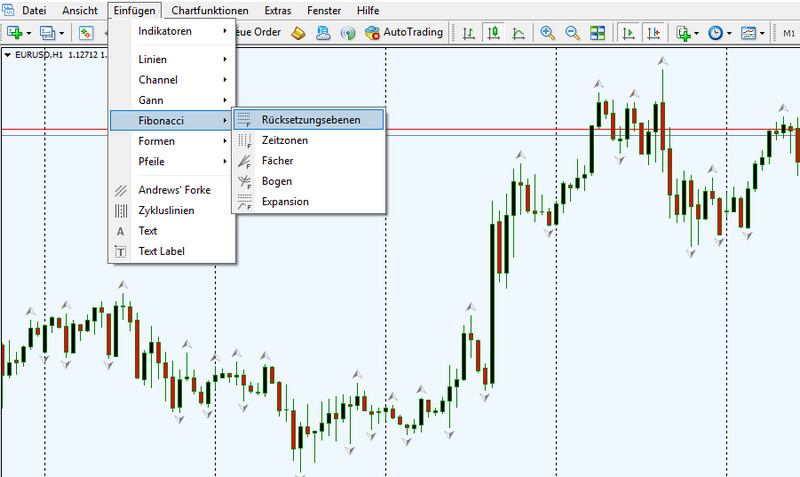
Now let's see the use of Fibonacci Retracements in Forex Trading. Fibonacci Retracements shows us a possible turning point, when a corrective movement is forming in a trend. Based on the indicated level of Fibonacci Points, lines mark a possible reversal of this correction to the original trend direction. This gives us the opportunity to enter in the market where it moves back in trend direction. It is important to know that a longer time frame, which is representrd by the Candels, is a more reliable indication of the strength of a trend than a short time frame. Therefore it is reasonable to trade at least H1 charts with Fibonacci retracements or higher. First of course we need to know how we can represent the individual points of Fiboacci Retracements in the chart. The MT4 platform has the Fibonacci Retracements already integrated, we just have to add them in our chart. On the menu bar click "Insert". In the pull-down menu we will find the item "Fibonacci" and if we show it with the mouse, additional menu items will be displayed to the right. Here we will click on "Retracements".
The pointer changes to a cross with 4 lines next to it. With this we go on an upward trend at the lowest point of the detected trend, with a downward trend at the highest point and click there with the left mouse button. At this point, the underlined number is 476.4 is shown. In this we make a double click and on the left side of the underscore is now a yellow dot. Now, when we click the left mouse button on the point and drag your mouse to the highest or lowest point of the trend, the Retracment Points are drawn with the corresponding lines in the chart. The result should look something like the figure below.
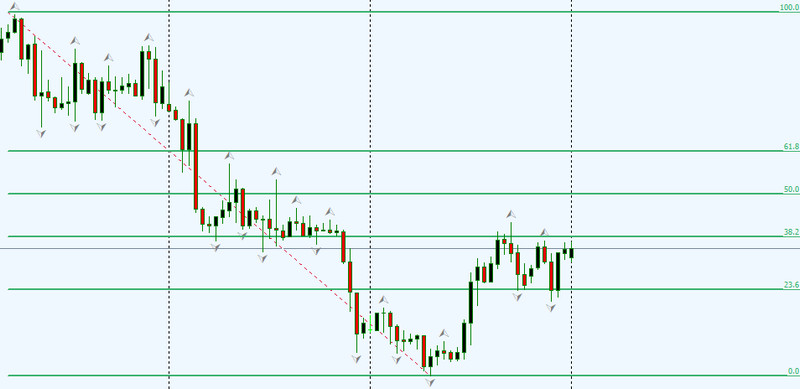
Now it's about to learn what these lines statements. The individual lines represent a range in which a reversal of the correction movement is likely to be more or less strong or the trend has turned. In particular, these areas are as follows to evaluate:
0 = The lowest or highest point of the detected trend.
23.6 = Here the correction has just begun and a reversal is unlikely.
38.2 = At very strong, long lasting trends, it may already be a reversal here.
50.0 = This is the area in the case of a normal trend most likely uses the inverse of the correction.
61.8 = If this area is broken, the trend has slowed significantly. Here it says, wait then if the course turns back in trend direction.
76.4 = If this line is broken, the trend has reversed with very high probability. * This line is not drawn in the standard. How you insert this line is explained at the end of this article.
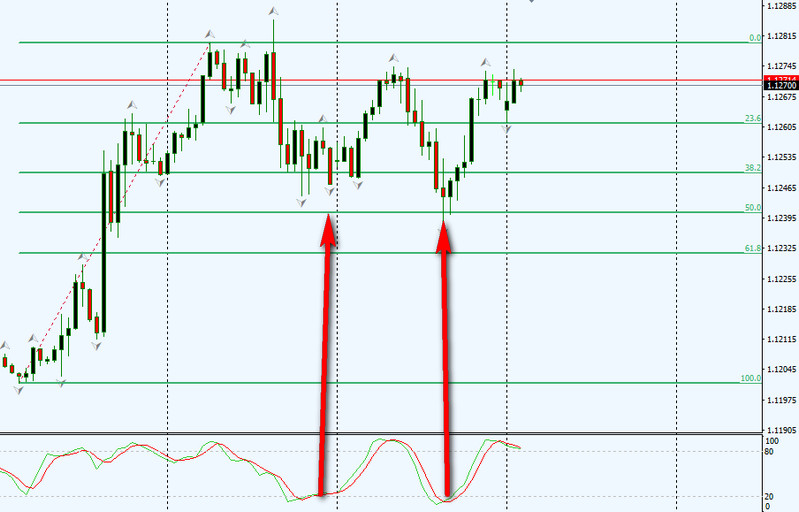
Of course it is difficult to recognize using only the areas of the Fibonacci Retracements whether the course is about to turn the direction. For this purpose it is recommended to take a oscilator as the Stochastics or RSI for help to see if the pair is overbought or oversold.
Insert the line 76.4
Double click on the dashed red, diagonal line within the Fibonacci lines. At the ends of the line a yellow dot will appear. In this click with the right mouse button and then go to "Fibo properties," the top item. In the dialog box that opens, click on "Add". From the right side you will see an input field. In this type the value "0.764". Now double-click in the box next to it and enter "76.4" one. This is the value that is displayed in the chart.
