The Forex indicators
If you have read our previous article already, then you have met the indicators already several times. So far, however, they are nothing more than a name without a face. This we are going to change with this article. Anticipation must be said that there is such a variety of indicators that we can not imagine all in one article, without you to death with information. For this reason, in this article is only a portion of the indicators, which provide you with sufficient information to meet well-reasoned and profitable trading decisions.
The chart
We come to the first indicator, to the chart. A chart on which the price of a currency pair curves is graphically most of us have probably already seen. But how can this chart to help us in our decisions about buying or selling. In Forex-Trading it is the specific form of chart showing further helps the trader's decisions, namely the candlestick chart. As this looks like and how the Candelsticks help you make the right decisions, we will explain in the next paragraph.
Example:
Chart Example
The Candelsticks
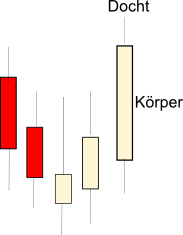
The candlestick represents the evolution of a currency pair for a specified period of time. It has got its name from its appearance. The plug body at its lower end is the rate at the beginning of the illustrated time period, and at its upper end at the end of the course of the displayed time period.
The wick of the candle can swing both upwards and downwards. In both directions on a candle. It represents the highest or lowest price during the time period shown represent.
Example:
Candlesticks
The Moving Average
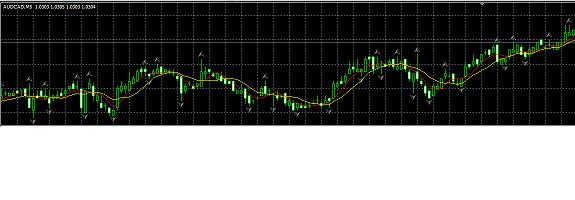
The moving average is the moving average of a currency pair represents. He is shown with a line on the chart, which is placed behind the curves of the candlesticks, followed from the findings on recent price action. The moving average shows indeed only see the last price development, but may be incurred based on patterns, in conjunction with other indicators, conclusions regarding the further course development to draw a possible decision to buy or sell a currency pair to meet.
In the example image the moving average is shown by the yellow line.
MA

Trendlines
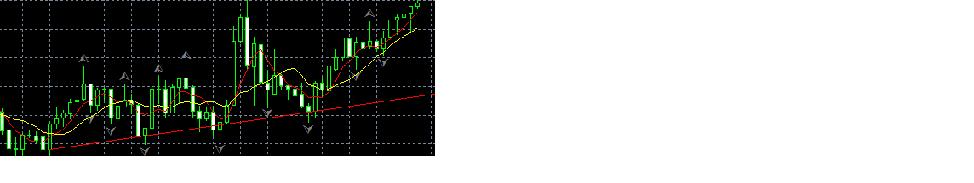
The function of the trendline is already aptly described by its name. It can identify existing trends and trend changes.
There are no hard and fast rule, as the trend line will be drawn into the chart, but there are guidelines to which we should adhere. The trendline in an uptrend is pulled below the candlestick, and that at the lowest point at the beginning of the trend along the curves downward trend during the course. By convention, the longer the trend line and the more often the lows are in contact with the line, the more stable is the trend. In downtrends will proceed the other way around as in uptrends. The line will be drawn on top of the candlesticks. Simultaneously should be noted that the time period of the candlestick is important for the validity of the trend line. The greater the illustrated time period, the more stable is the trend. Also applies that, in the control, with a flat sloping line, the trend is more stable than at a relatively steep line.
Example: